For quite some time, our production Azure SQL Database suffered from unpredictable CPU spikes and throughput instability. While index tuning and routine maintenance offered some relief, the underlying “jitter” persisted. It wasn’t until we revisited our MAXDOP (Maximum Degree of Parallelism) settings that we finally achieved a stable baseline.
Here is how we identified the bottleneck and the impact of the fix.
Infrastructure Context
Our environment runs on Azure SQL Serverless with a 32 vCore cap. The workload is primarily OLTP traffic punctuated by periodic, heavy reporting bursts. This combination creates a high-concurrency environment where resource availability is critical.
The Problem: The “Uncapped” Default
The database’s MAXDOP was set at the default value of 0. While this allows a query to use all available vCores, in a high-concurrency environment, it often leads to diminishing returns and resource exhaustion.
When expensive queries run uncapped:
- Resource Starvation: A single heavy report can claim every available vCore. This leaves concurrent transactional queries stalled in the queue while waiting for execution threads.
- The Parallelism Tax: Beyond a certain threshold, the overhead of thread management, context switching, and massive memory grants outweighs the potential speed gains of adding more cores.
Our earlier mitigation was simply throwing money at the problem by scaling up vCores to provide enough headroom for these spikes. We hesitated to adjust MAXDOP due to fears of slowing down large reports, but the impact of “over-parallelism” eventually became impossible to ignore.
The Evidence: Telemetry and Wait Patterns
To build a data-driven case for change, I dove into the sysstats and wait types. Three indicators stood out:
- Thread Saturation per Query: Active session monitoring revealed numerous queries consuming every available vCore. By querying
sys.dm_exec_query_stats, I identified a pattern whereMaxDopReachedconsistently matched our 32-vCore limit. This confirmed that single requests were monopolizing the entire worker pool.
SELECT TOP 20
    MAX(qs.last_dop) AS MaxDopReached,
    COUNT(*) AS ExecutionCount,
    SUBSTRING(st.text, (qs.statement_start_offset / 2) + 1,
        ((CASE statement_end_offset
            WHEN -1 THEN DATALENGTH(st.text)
            ELSE qs.statement_end_offset
          END
          - qs.statement_start_offset) / 2) + 1) AS QueryText
FROM sys.dm_exec_query_stats AS qs
CROSS APPLY sys.dm_exec_sql_text(qs.sql_handle) AS st
WHERE qs.last_execution_time > DATEADD(hour, -1, GETDATE())
GROUP BY st.text, qs.statement_start_offset, qs.statement_end_offset
ORDER BY MaxDopReached DESC;- Query Store Wait Statistics: In the Query Store, the “Parallelism” and “Latch” categories were the dominant bottlenecks by a massive margin. Specifically, high CXPACKET and CXSYNC_PORT values signaled that threads were spending more time on coordination than on actual data processing. The high LATCH_EX waits corroborated the theory of internal resource competition, indicating that threads were frequently stalled while waiting for access to internal data structures.

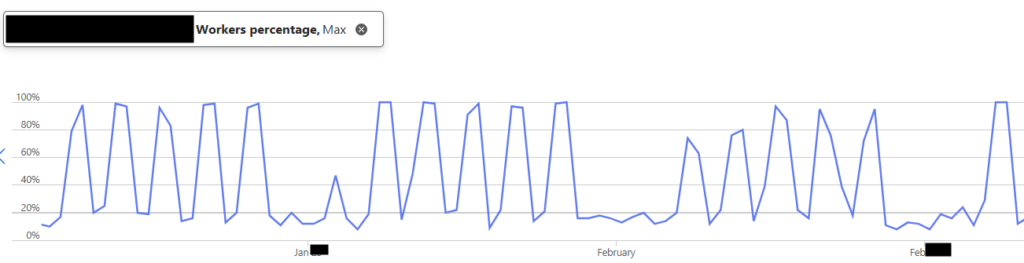
- Worker Pool Volatility: Azure Portal metrics showed a jagged, spiky pattern that frequently hit 100% worker utilization during report runs.
The data was clear: we weren’t just running queries; we were over-parallelizing them to the point of diminishing returns.
The Solution: Aligning with Best Practices
Following Microsoft’s official recommendations, we decided to cap MAXDOP at 8.
Since we were using Azure SQL Database, we applied this as a Database Scoped Configuration.
ALTER DATABASE SCOPED CONFIGURATION SET MAXDOP = 8;The change does not require downtime. However, because it can trigger plan recompilations, we implemented it during a low-usage window to avoid transient variability.
The Outcome: Stability Found
The results were immediate and exceeded our expectations. By introducing a strategic constraint, we unlocked higher system-wide throughput and more predictable application behavior.
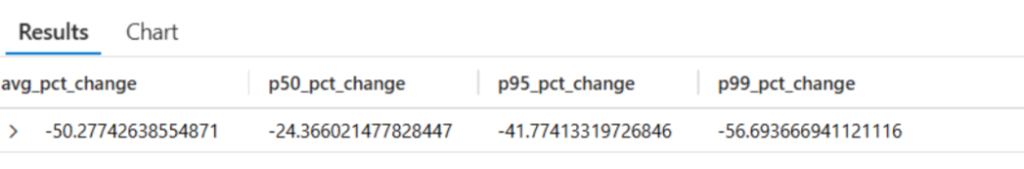
- Massive Latency Reduction: Our SQL Dependency telemetry in Application Insights showed a dramatic shift in performance across all percentiles. Our p99 dependency duration saw a staggering 56.6% improvement, while the average latency dropped by 50%.
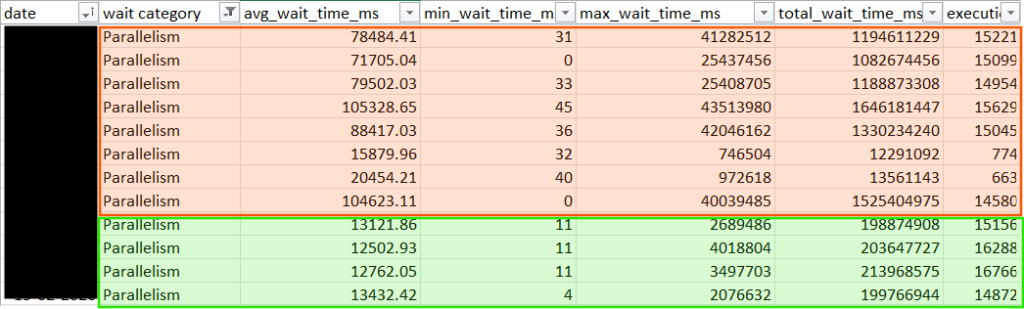
- Wait Time Crash: While the Parallelism category remains a primary wait type, the average duration of these waits plummeted by 84%. Other wait categories also declined significantly, indicating a broader reduction in scheduling and resource contention.
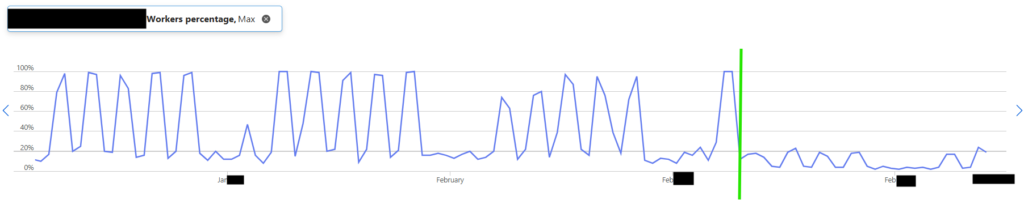
- Worker Stability: Our Worker Percentage dropped from a volatile 100% to a steady 25% average, providing plenty of “breathing room” for traffic surges.
- Zero Complaints: Most importantly, end-users reported no degradation in large report performance. The queries simply ran more efficiently with fewer resources.
Overall, adjusting MAXDOP delivered measurable gains in performance and throughput while keeping compute limits unchanged.
Cost Implication
Instead of scaling up to chase performance, we optimized how the existing compute was used. The result was better throughput and a more predictable workload, without higher compute costs.
Final Thoughts
If you are running on Azure SQL with default settings, check your MAXDOP today. Capping parallelism didn’t just make our queries faster; it made our entire environment more predictable and responsive. Performance tuning is often a game of finding the right constraints, not just removing them.