Category: Performance Tuning

  • Semantic Caching: A Key LLM Optimization Technique I Learned While Experimenting with Semantic Kernel in C# (.NET)

    While exploring Semantic Kernel in the familiar world of C# and .NET, I came across an interesting LLM optimization technique called Semantic Caching.

    Semantic caching helps reduce both LLM latency and cost by reusing responses for queries that are semantically similar, even if they are phrased differently. This can be particularly useful in chat completion scenarios, where many user queries often express the same intent in slightly different ways.

    In this post, I’ll briefly explain the concept, walk through a simple implementation approach, and highlight a few important considerations when applying semantic caching in real-world systems.

    The Problem

    LLM-powered systems often receive queries that are worded differently but express the same intent.

    For example:

    • “What is the capital of France?”
    • “Which city is the capital of France?”
    • “Tell me the capital city of France.”

    Despite their similarity, a typical LLM-based system treats each of these as a separate request, triggering a new embedding lookup, retrieval step, and model inference every time.

    This leads to repeated computation, increased latency, and higher operational cost, especially in high-traffic applications where similar queries occur frequently.

    A Typical RAG Pipeline

    Many applications use Retrieval Augmented Generation (RAG) to ground responses with external knowledge.

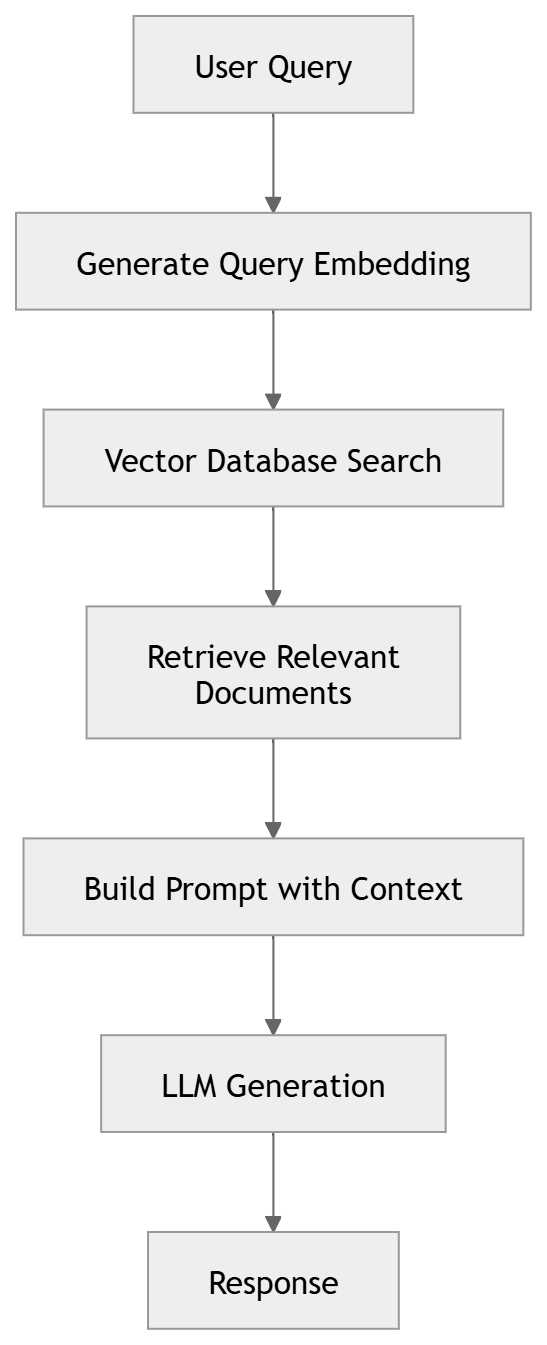
    Each request typically involves three steps: embedding generation, vector search, and LLM inference.
    While embeddings and vector search are relatively inexpensive, LLM inference is the most costly operation, both in latency and token consumption.

    What is Semantic Caching?

    Traditional caching relies on exact key matches, which rarely work for LLM prompts.

    Semantic caching addresses this by comparing the meaning of queries using embeddings rather than relying on exact text matches.

    The workflow is as follows:

    1. Convert the query to an embedding
    2. Search the cache for similar embeddings
    3. If a match exists, return the cached response
    4. Otherwise execute the normal pipeline and cache the result

    Where Semantic Caching Works Best

    Semantic caching is particularly effective in scenarios where similar questions are asked repeatedly with minor variations in wording. Some common examples include:

    • Customer support chatbots
      Users often ask the same questions in different ways (e.g., account issues, policies, product details), making them strong candidates for cache reuse.
    • Knowledge base or documentation assistants
      Queries about product features, APIs, troubleshooting steps, or documentation content frequently overlap semantically.
    • Internal enterprise copilots
      Employees often ask repeated questions about company policies, internal tools, or organizational information.
    • FAQ-style applications
      Systems designed around frequently asked questions naturally benefit from semantic reuse.

    In these scenarios, semantic caching can help reduce repeated LLM calls, lower token costs, and significantly improve response latency.

    RAG with Semantic Caching

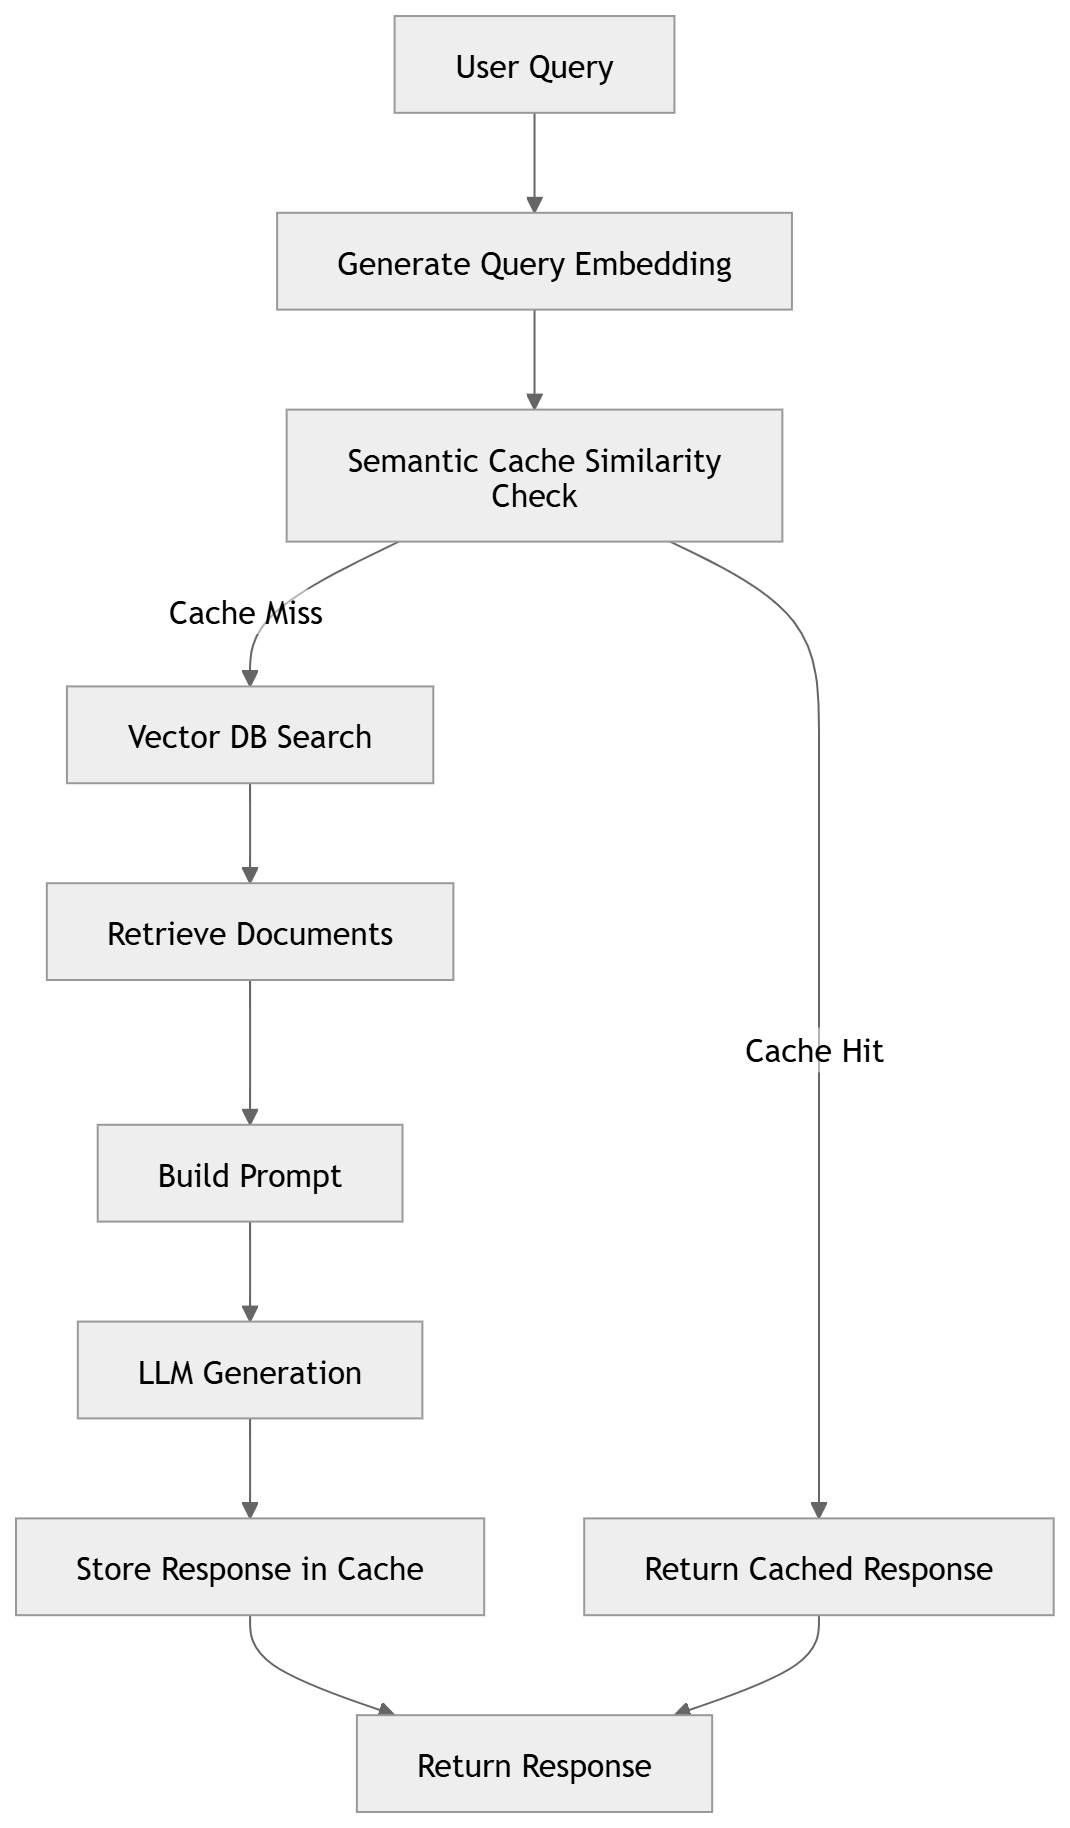
    When a semantically similar query is found, the system can skip both retrieval and LLM inference, returning the cached response immediately.

    Implementation with Semantic Kernel (C#)

    Below are code snippets from a small POC implementation (AI-assisted) built using Semantic Kernel with Azure OpenAI models for chat completion and embedding generation. The example uses an in-memory vector store for RAG documents and a simple in-memory cache to demonstrate the semantic caching concept.

    For more advanced implementations and patterns, I recommend exploring the Semantic Kernel GitHub repository.

    • Initializing Chat Completion
    const string modelId = "gpt-5-nano";
    const string endpoint = "{endpoint}";
    const string apiKey = "{apiKey}";
    
    var builder = Kernel.CreateBuilder().AddAzureOpenAIChatCompletion(
        modelId,
        endpoint,
        apiKey,
        httpClient: httpClient);
    
    // other initializations..
    Kernel kernel = builder.Build();
    
    ChatCompletionAgent agent =
        new()
        {
            Name = AgentName,
            Instructions = AgentInstructions,
            Kernel = kernel
        };
    
    // Create a thread for the agent
    ChatHistoryAgentThread agentThread = new();
    • Initializing the Embedding Generator
    const string embeddingDeploymentName = "text-embedding-ada-002";
    const string embeddingEndpoint = "{embeddingEndpoint }";
    const string embeddingApiKey = "{embeddingApiKey }";
    
    builder.Services.AddAzureOpenAIEmbeddingGenerator(
        deploymentName: embeddingDeploymentName,
        endpoint: embeddingEndpoint,
        apiKey: embeddingApiKey,
        httpClient: embeddingHttpClient);
    
    var embeddingGenerator = kernel.GetRequiredService<IEmbeddingGenerator<string, Embedding<float>>>();
    • Creating an In-Memory Vector Store for RAG Documents

    Next, we create an in-memory vector store and upload a few sample documents that will be used for retrieval.

    // Create a vector store for RAG documents
    var documentVectorStore = new InMemoryVectorStore(new() { EmbeddingGenerator = embeddingGenerator });
    using var textSearchStore = new TextSearchStore<string>(documentVectorStore, collectionName: "FinancialData", vectorDimensions: 1536);
    
    // Upsert documents into the vector store
    await textSearchStore.UpsertTextAsync(
        [
            "The financial results of Contoso Corp for 2024 is as follows:\nIncome EUR 154 000 000\nExpenses EUR 142 000 000",
            "The financial results of Contoso Corp for 2023 is as follows:\nIncome EUR 174 000 000\nExpenses EUR 152 000 000",
            "The financial results of Contoso Corp for 2022 is as follows:\nIncome EUR 184 000 000\nExpenses EUR 162 000 000",
            "The Contoso Corporation is a multinational business with its headquarters in Paris. The company is a manufacturing, sales, and support organization with more than 100,000 products.",
            "The financial results of AdventureWorks for 2021 is as follows:\nIncome USD 223 000 000\nExpenses USD 210 000 000",
            "AdventureWorks is a large American business that specializes in adventure parks and family entertainment.",
        ]);
    
    // Add text search provider for RAG
    var textSearchProvider = new TextSearchProvider(textSearchStore);
    agentThread.AIContextProviders.Add(textSearchProvider);
    • Computing Similarity Between Embeddings
      • To determine whether a query already exists in the semantic cache, we compare embeddings using cosine similarity. If the similarity exceeds a configured threshold, we consider the queries semantically equivalent.
      • A high threshold (e.g., > 0.95) typically indicates strong semantic similarity, though the optimal value may require tuning depending on the domain and query patterns.

    Note: At the time of writing this post, I did not find a built-in way in Semantic Kernel to directly inspect or filter similarity scores for vector search results, so a custom implementation was used.

    // Helper function to calculate cosine similarity between two embeddings
    float CalculateCosineSimilarity(ReadOnlyMemory<float> embedding1, ReadOnlyMemory<float> embedding2)
    {
        var vec1 = embedding1.Span;
        var vec2 = embedding2.Span;
    
        float dotProduct = 0f;
        float norm1 = 0f;
        float norm2 = 0f;
    
        for (int i = 0; i < vec1.Length; i++)
        {
            dotProduct += vec1[i] * vec2[i];
            norm1 += vec1[i] * vec1[i];
            norm2 += vec2[i] * vec2[i];
        }
    
        return dotProduct / (MathF.Sqrt(norm1) * MathF.Sqrt(norm2));
    }
    • Implementing Semantic Caching
      • The following helper method performs semantic cache lookup before invoking the RAG pipeline.
      • If a semantically similar query already exists in the cache, the stored response is returned. Otherwise, the agent is invoked and the new query–response pair is stored for future reuse.
    var semanticCache = new List<CacheRecord>();
    
    async Task<string> GetResponseWithSemanticCaching(string query, double similarityThreshold = 0.95)
    {
        var sw = Stopwatch.StartNew();
        try
        {
            Console.WriteLine($"\n[Query]: {query}");
    
            // Generate embedding for the query
            var embeddingResult = await embeddingGenerator.GenerateAsync([query]);
            var queryEmbedding = embeddingResult[0].Vector;
    
            // Search for similar queries in the cache
            CacheRecord? bestMatch = null;
            float bestScore = 0f;
    
            foreach (var cachedItem in semanticCache)
            {
                var similarity = CalculateCosineSimilarity(queryEmbedding, cachedItem.Embedding);
                if (similarity > bestScore)
                {
                    bestScore = similarity;
                    bestMatch = cachedItem;
                }
            }
    
            // Check if we found a match above the threshold
            if (bestMatch != null && bestScore >= similarityThreshold)
            {
                Console.WriteLine($"[Cache Hit] - Found similar query (Score: {bestScore:F4})");
                Console.WriteLine($"[Similar Query]: {bestMatch.Query}");
                Console.WriteLine($"[Cached Response]: {bestMatch.Response}");
                return bestMatch.Response;
            }
    
            Console.WriteLine("[Cache Miss] - No similar queries found in cache");
    
            // If no cache hit, invoke the agent
            Console.WriteLine("[Invoking Agent]...");
            ChatMessageContent message = await agent.InvokeAsync(query, agentThread).FirstAsync();
            var response = message.Content ?? string.Empty;
            Console.WriteLine($"[Agent Response]: {response}");
    
            // Store the query-response pair in cache
            var cacheRecord = new CacheRecord
            {
                Key = Guid.NewGuid().ToString(),
                Query = query,
                Response = response,
                Embedding = queryEmbedding
            };
            semanticCache.Add(cacheRecord);
            Console.WriteLine("[Cached] - Query and response stored for future use");
            return response;
        }
        finally
        {
            sw.Stop();
            Console.WriteLine($"[Time Taken]: {sw.ElapsedMilliseconds} ms");
        }
    }

    Experiment Setup

    The following experiment was conducted to observe the behavior of semantic caching.

    ComponentConfiguration
    Chat Modelgpt-5-nano
    Embedding Modeltext-embedding-ada-002
    Vector StoreIn-memory vector store
    Cache ImplementationIn-memory list
    Similarity MetricCosine similarity
    Similarity Threshold0.95
    DatasetSample financial and company information documents
    Execution EnvironmentLocal machine

    Experiment Results

    #User QueryCache StatusSimilar Query FoundSimilarity ScoreSanitized ResponseTotal TokensTime Taken
    1Where is Contoso based?Cache MissContoso is headquartered in Paris7256215 ms
    2Where is Contoso located?Cache HitWhere is Contoso based?0.9714Contoso is headquartered in Paris53 ms
    3What was its expenses for 2022?Cache MissExpenses for 2022: 162,000,000 EUR10395093 ms
    4What were the expenses in 2022?Cache HitWhat was its expenses for 2022?0.9773Expenses for 2022: 162,000,000 EUR60 ms
    5What were the expenses in 2023?Cache MissExpenses in 2023: 152,000,000 EUR7784373 ms
    6What were the financial results for 2022?Cache MissIncome: 184,000,000 EUR; Expenses: 162,000,000 EUR; Net profit: 22,000,000 EUR10004903 ms
    7What were the financial results for 2023?Cache HitWhat were the financial results for 2022?0.9638Income: 184,000,000 EUR; Expenses: 162,000,000 EUR; Net profit: 22,000,000 EUR281 ms
    8What was its financial results for 2023?Cache MissIncome: 174,000,000 EUR; Expenses: 152,000,000 EUR; Net profit: 22,000,000 EUR10944518 ms
    9give me the financial results for 2023?Cache HitWhat was its financial results for 2023?0.9522Income: 174,000,000 EUR; Expenses: 152,000,000 EUR; Net profit: 22,000,000 EUR52 ms
    10What was Contoso’s income in 2023?Cache MissContoso’s income in 2023 was 174,000,000 EUR8382474 ms
    11Where is Contoso based?Cache HitWhere is Contoso based?1.0000Contoso is headquartered in Paris83 ms

    Observations

    • Token consumption eliminated for cache hits (major cost optimization)
      LLM calls consumed approximately 700–1000+ tokens per query. When a cache hit occurred, the stored response was reused, eliminating the need for an LLM call and avoiding token usage entirely. In high-traffic systems where many queries are semantically similar, even a modest cache hit rate can significantly reduce overall LLM costs.
    • Significant latency reduction
      LLM invocations took roughly 2–6 seconds, while cache hits returned responses in 50–80 ms, resulting in responses that were nearly 100× faster.
    • Semantic similarity works well for paraphrased queries
      Queries such as “Where is Contoso based?” and “Where is Contoso located?” were correctly matched with a similarity score of ~0.97, allowing the cached response to be reused.
    • Cache reuse works across slightly rephrased queries
      For example, “What were its financial results for 2023?” and “Give me the financial results for 2023.” were matched successfully, demonstrating the advantage of semantic matching over traditional exact-key caching.
    • Vector similarity can produce false positives
      The query “What were the financial results for 2023?” matched the cached query “What were the financial results for 2022?” with a similarity score of 0.96, resulting in 2022 results being returned for a 2023 query.
    • Additional validation may be required in real systems
      Because semantic similarity alone does not always guarantee correctness, production implementations often combine semantic matching with keyword filtering, metadata checks, or hybrid search techniques.

    Important Considerations

    • Similarity Threshold Selection
      The similarity threshold plays a critical role in determining when a cached response can be reused. A threshold that is too high may reduce cache effectiveness, while a lower threshold increases the risk of incorrect responses being reused.
    • Risk of Semantic False Positives
      Vector similarity measures semantic closeness, but it does not guarantee contextual correctness. Queries that differ in critical details such as dates, identifiers, or product names may still appear highly similar in embedding space. Additional safeguards may be needed to prevent incorrect cache reuse.
    • Hybrid Search for Safer Cache Retrieval
      Because vector similarity alone can produce false positives, many implementations combine semantic similarity with keyword or metadata filtering. This hybrid approach helps ensure that key tokens such as years, IDs, or entity names match before returning a cached response.
    • Cache Scope and Authorization Boundaries
      Cached responses must respect user or tenant boundaries. Responses containing user-specific or tenant-specific data should not be reused across different contexts. One approach is to segment the cache by user, tenant, or authorization scope so that cached responses are only reused within the correct boundary.
    • Production-Ready Vector Storage
      The example implementation uses an in-memory cache and vector store for simplicity. In production systems, scalable vector-capable stores such as Redis (with vector similarity search), Azure AI Search, or PostgreSQL with pgvector are typically used. These systems provide persistent storage, indexing, and efficient similarity search for large embedding datasets, enabling semantic caches to scale to high query volumes.
    • Cache Expiration and Data Freshness
      Cached responses may become stale as underlying data changes. Introducing TTL (time-to-live) policies or invalidation mechanisms helps ensure that responses remain accurate over time.

    Final Thoughts

    As LLM applications scale, optimizing latency and cost becomes critical. Semantic caching is a simple technique that can significantly reduce repeated LLM calls by reusing responses for semantically similar queries.

    While experimenting with Semantic Kernel, this turned out to be one of the most practical optimization techniques to implement.

  • How a Database Migration Helped Us Discover and Consolidate 80+ Overlapping SQL Indexes

    Database migrations often reveal hidden technical debt. During a recent effort to minimize migration windows, we discovered more than 80 overlapping indexes in our SQL environment. The impact on write amplification and storage overhead was too significant to ignore.

    While our broader database migration journey deserves its own post, this article focuses on the framework we used to identify and consolidate these overlapping indexes.

    What are Overlapping Indexes

    Overlapping indexes are “clones” or subset indexes that are either exact duplicates or significantly redundant. These often accumulate during rapid development due to inadequate change review processes, lack of awareness, or improper use of missing index recommendations.

    Unlike unused indexes (which receive no reads), overlapping indexes might still be used by the optimizer, but their existence is redundant because a superset index could handle the same workload.

    These can often be outright deleted or merged into a single, high-performance structure that covers all necessary query patterns.

    The Hidden Cost of Overlapping Indexes

    Overlapping indexes might seem harmless because they don’t break your queries, but they act as a “silent tax” on your database. Here are the critical pain points:

    • Increased Write Latency: Every time you perform an INSERT, UPDATE, or DELETE, the SQL engine must maintain every single related index. If you have three overlapping indexes, you are essentially asking the database to write the same piece of data three times, consuming excessive CPU, disk I/O, and memory.
    • Storage Bloat: Indexes occupy physical space on your disk. Overlapping indexes store nearly identical data across multiple B-tree structures. In large-scale systems, this can lead to gigabytes or even terabytes of wasted storage.
    • Maintenance Overhead: Tasks like index rebuilds, reorganizations, and statistics updates take significantly longer. This extends your maintenance windows and consumes CPU resources that could be better used for active workloads.

    The Framework: Identify, Review, Execute & Monitor

    To systematically address the issue, we used a simple four-step framework: identify potential overlaps, manually review candidates, execute consolidation changes in batches, and monitor system stability.

    Identify

    • Leverage system catalog views and DMVs to identify indexes with overlapping key columns. The script below (AI-assisted) flags such indexes for manual review.
    • The results are sorted by the combined size of overlapping indexes for each key column definition. The overlap count can also be used as a prioritization factor.
    WITH idx AS (
        SELECT
            i.object_id,
            i.index_id,
            i.name,
            key_columns =
                STRING_AGG(CONVERT(nvarchar(4000), c.name)
                    + CASE WHEN ic.is_descending_key = 1 THEN ' DESC' ELSE ' ASC' END, ', ')
                WITHIN GROUP (ORDER BY ic.key_ordinal)
        FROM sys.indexes i
        JOIN sys.index_columns ic
            ON ic.object_id = i.object_id
           AND ic.index_id = i.index_id
        JOIN sys.columns c
            ON c.object_id = ic.object_id
           AND c.column_id = ic.column_id
        WHERE i.index_id > 0
          AND ic.key_ordinal > 0
          AND OBJECTPROPERTY(i.object_id,'IsUserTable') = 1
        GROUP BY i.object_id, i.index_id, i.name
    ),
    
    idx_size AS (
        SELECT
            object_id,
            index_id,
            SUM(reserved_page_count) * 8.0 / 1024 AS size_mb
        FROM sys.dm_db_partition_stats
        GROUP BY object_id, index_id
    )
    
    SELECT
        QUOTENAME(OBJECT_SCHEMA_NAME(i.object_id)) + '.'
            + QUOTENAME(OBJECT_NAME(i.object_id)) AS table_name,
    
        i.key_columns AS key_column_definition,
    
        -- Identical key indexes
        STRING_AGG(i.name, '; ') AS indexes_with_identical_keys,
    
        -- Superset indexes
        super.indexes_with_prefix_superset,
    
        COUNT(*) 
          + ISNULL(super.super_count, 0) AS total_overlapping_index_count,
    
        -- NEW: Collective size (identical + supersets)
        ROUND(
            SUM(ISNULL(s.size_mb, 0))
            + ISNULL(super.super_size_mb, 0),
            2
        ) AS total_overlapping_index_size_mb
    
    FROM idx i
    
    LEFT JOIN idx_size s
        ON s.object_id = i.object_id
       AND s.index_id = i.index_id
    
    OUTER APPLY (
        SELECT
            STRING_AGG(i2.name, '; ') AS indexes_with_prefix_superset,
            COUNT(*) AS super_count,
            SUM(ISNULL(s2.size_mb, 0)) AS super_size_mb
        FROM idx i2
        LEFT JOIN idx_size s2
            ON s2.object_id = i2.object_id
           AND s2.index_id = i2.index_id
        WHERE i2.object_id = i.object_id
          AND i2.key_columns LIKE i.key_columns + ', %'
    ) super
    
    GROUP BY
        i.object_id,
        i.key_columns,
        super.indexes_with_prefix_superset,
        super.super_count,
        super.super_size_mb
    
    HAVING
        COUNT(*) > 1
        OR ISNULL(super.super_count, 0) > 0
    
    ORDER BY
        total_overlapping_index_size_mb DESC,
        table_name;

    Interpreting the Script Output

    • table_name: The fully qualified table name (schema + table) where the overlapping indexes exist.
    • key_column_definition: The ordered list of index key columns, including their sort direction (ASC/DESC). This represents the base key structure used to detect identical or prefix-overlapping indexes.
    • indexes_with_identical_keys: A semicolon-separated list of index names that share the exact same key column definition.
    • indexes_with_prefix_superset: Indexes whose key columns begin with the same column sequence as the base definition but contain additional trailing columns. These represent potential superset indexes.
    • total_overlapping_index_count: The total number of related indexes detected for that key definition, including both identical indexes and prefix supersets.
    • total_overlapping_index_size_mb: The combined storage size, in megabytes, of all related indexes (identical and superset indexes). This helps prioritize cleanup by highlighting the largest storage and maintenance impact.

    Review

    • I want to emphasize that a manual review of the output is crucial. The script can flag false positives, so directly deleting the identified indexes is not advisable.
    • Instead, select a key column definition from the results and examine the corresponding identical indexes and prefix supersets for consolidation opportunities.
    • The decision matrix below provides general guidance for evaluating common overlap patterns and determining whether indexes can be dropped, retained, or merged.
    • While the table covers many common scenarios, it is not exhaustive. Cases such as unique constraints, filtered indexes, or other specialized index configurations require additional consideration. Nevertheless, the same principle applies: identify redundant structures and consolidate them into a single index that efficiently supports the required query patterns.
    Index PatternExample Index 1Example Index 2RelationshipTypical DecisionReason
    Exact DuplicateKEY (A ASC, B ASC)KEY (A ASC, B ASC)IdenticalDrop oneBoth indexes are identical.
    Duplicate + INCLUDEKEY (A ASC, B ASC)KEY (A ASC, B ASC) INCLUDES (C, D)Index 2 is supersetKeep Index 2, drop Index 1Index 2 already contains everything in Index 1.
    Prefix SupersetKEY (A ASC, B ASC)KEY (A ASC, B ASC, C ASC)Index 2 extends Index 1Drop Index 1Index 2 can still support queries using A and B.
    Key Order VariationKEY (A ASC, B ASC)KEY (B ASC, A ASC)Different leading columnKeep bothLeading column changes query access path.
    INCLUDE ExpansionKEY (A ASC, B ASC) INCLUDES (C)KEY (A ASC, B ASC) INCLUDES (C, D)Index 2 is supersetKeep Index 2, drop Index 1Index 2 covers the same queries as Index 1.
    Partial OverlapKEY (A ASC, B ASC)KEY (A ASC, C ASC)Shared first columnKeep bothEach index supports different query filters.
    Merge CandidateKEY (A ASC, B ASC) INCLUDES (C)KEY (A ASC, B ASC) INCLUDES (D, E)Same keys, different INCLUDE columnsMerge Index 1 into Index 2, then drop Index 1Combine INCLUDE columns into one index.

    Execute & Monitor

    • Given the large number of index changes, we rolled out the consolidation in batches of two for severe overlaps and batches of five for less severe ones to better manage risk.
    • Changes were applied during non-peak hours to minimize disruption, followed by a smoke test of the affected modules to validate application behavior.
    • Post-rollout, we used Application Insights to monitor SQL dependency performance and ensure that query execution and overall database performance remained stable.
    • Since the primary objective was to optimize database migration windows by reducing index rebuild times, our monitoring focused on system stability rather than quantifying performance gains.

    Result

    • Index maintenance windows reduced by up to 30%.
      Consolidating overlapping indexes significantly shortened our periodic index maintenance cycles.
    • Database migration windows improved.
      Faster index rebuilds helped reduce overall migration time, which was the primary objective of the effort.
    • Storage reclaimed across database instances.
      Several gigabytes of storage were logically recovered by removing redundant indexes.
    • Potential improvement in write performance and resource utilization.
      Although we did not formally measure changes in write throughput or overall resource consumption, reducing redundant indexes should positively impact both write performance and database resource utilization.
    • Simpler index management.
      With a cleaner and consolidated index landscape, evaluating future index additions or updates became much easier.

    Preventing Recurrence

    • Stronger index governance going forward.
      We introduced internal technical guidelines to prevent similar overlaps and strengthened the review process for index changes.
    • Proactive monitoring for new overlaps.
      We implemented weekly insights, leveraging the earlier script, to detect newly introduced overlapping indexes early and address them promptly.

    Summary

    Overlapping indexes introduce unnecessary overhead, impacting both maintenance and performance. This type of technical debt can accumulate gradually over time.

    If your indexes have not been reviewed recently, a periodic audit can be worthwhile. Periodic review and consolidation help reduce maintenance overhead and keep the index landscape manageable.

  • Capping MAXDOP in Azure SQL: How a Single Change Delivered a 57% Performance Gain

    For quite some time, our production Azure SQL Database suffered from unpredictable CPU spikes and throughput instability. While index tuning and routine maintenance offered some relief, the underlying “jitter” persisted. It wasn’t until we revisited our MAXDOP (Maximum Degree of Parallelism) settings that we finally achieved a stable baseline.

    Here is how we identified the bottleneck and the impact of the fix.

    Infrastructure Context

    Our environment runs on Azure SQL Serverless with a 32 vCore cap. The workload is primarily OLTP traffic punctuated by periodic, heavy reporting bursts. This combination creates a high-concurrency environment where resource availability is critical.

    The Problem: The “Uncapped” Default

    The database’s MAXDOP was set at the default value of 0. While this allows a query to use all available vCores, in a high-concurrency environment, it often leads to diminishing returns and resource exhaustion.

    When expensive queries run uncapped:

    • Resource Starvation: A single heavy report can claim every available vCore. This leaves concurrent transactional queries stalled in the queue while waiting for execution threads.
    • The Parallelism Tax: Beyond a certain threshold, the overhead of thread management, context switching, and massive memory grants outweighs the potential speed gains of adding more cores.

    Our earlier mitigation was simply throwing money at the problem by scaling up vCores to provide enough headroom for these spikes. We hesitated to adjust MAXDOP due to fears of slowing down large reports, but the impact of “over-parallelism” eventually became impossible to ignore.

    The Evidence: Telemetry and Wait Patterns

    To build a data-driven case for change, I dove into the sysstats and wait types. Three indicators stood out:

    • Thread Saturation per Query: Active session monitoring revealed numerous queries consuming every available vCore. By querying sys.dm_exec_query_stats, I identified a pattern where MaxDopReached consistently matched our 32-vCore limit. This confirmed that single requests were monopolizing the entire worker pool.
    SELECT TOP 20
        MAX(qs.last_dop) AS MaxDopReached,
        COUNT(*) AS ExecutionCount,
        SUBSTRING(st.text, (qs.statement_start_offset / 2) + 1,
            ((CASE statement_end_offset
                WHEN -1 THEN DATALENGTH(st.text)
                ELSE qs.statement_end_offset
              END
              - qs.statement_start_offset) / 2) + 1) AS QueryText
    FROM sys.dm_exec_query_stats AS qs
    CROSS APPLY sys.dm_exec_sql_text(qs.sql_handle) AS st
    WHERE qs.last_execution_time > DATEADD(hour, -1, GETDATE())
    GROUP BY st.text, qs.statement_start_offset, qs.statement_end_offset
    ORDER BY MaxDopReached DESC;
    • Query Store Wait Statistics: In the Query Store, the “Parallelism” and “Latch” categories were the dominant bottlenecks by a massive margin. Specifically, high CXPACKET and CXSYNC_PORT values signaled that threads were spending more time on coordination than on actual data processing. The high LATCH_EX waits corroborated the theory of internal resource competition, indicating that threads were frequently stalled while waiting for access to internal data structures.
    • Worker Pool Volatility: Azure Portal metrics showed a jagged, spiky pattern that frequently hit 100% worker utilization during report runs.

    The data was clear: we weren’t just running queries; we were over-parallelizing them to the point of diminishing returns.

    The Solution: Aligning with Best Practices

    Following Microsoft’s official recommendations, we decided to cap MAXDOP at 8.

    Since we were using Azure SQL Database, we applied this as a Database Scoped Configuration.

    ALTER DATABASE SCOPED CONFIGURATION SET MAXDOP = 8;

    The change does not require downtime. However, because it can trigger plan recompilations, we implemented it during a low-usage window to avoid transient variability.

    The Outcome: Stability Found

    The results were immediate and exceeded our expectations. By introducing a strategic constraint, we unlocked higher system-wide throughput and more predictable application behavior.

    • Massive Latency Reduction: Our SQL Dependency telemetry in Application Insights showed a dramatic shift in performance across all percentiles. Our p99 dependency duration saw a staggering 56.6% improvement, while the average latency dropped by 50%.
    • Wait Time Crash: While the Parallelism category remains a primary wait type, the average duration of these waits plummeted by 84%. Other wait categories also declined significantly, indicating a broader reduction in scheduling and resource contention.
    • Worker Stability: Our Worker Percentage dropped from a volatile 100% to a steady 25% average, providing plenty of “breathing room” for traffic surges.
    • Zero Complaints: Most importantly, end-users reported no degradation in large report performance. The queries simply ran more efficiently with fewer resources.

    Overall, adjusting MAXDOP delivered measurable gains in performance and throughput while keeping compute limits unchanged.

    Cost Implication

    Instead of scaling up to chase performance, we optimized how the existing compute was used. The result was better throughput and a more predictable workload, without higher compute costs.

    Final Thoughts

    If you are running on Azure SQL with default settings, check your MAXDOP today. Capping parallelism didn’t just make our queries faster; it made our entire environment more predictable and responsive. Performance tuning is often a game of finding the right constraints, not just removing them.