With the rapid explosion of AI tools and platform choices, it’s easy to feel overwhelmed when figuring out how to start building AI agents that actually work in practice. In this post, I’ll use a SQL database assistant as a concrete example to demonstrate how to build context-aware AI agents in .NET using the Model Context Protocol (MCP) and Semantic Kernel. The goal isn’t to present a comprehensive production-ready design, but to introduce the core approach for turning structured systems into conversational ones.
Core Concepts
- Tool Calling: The capability of an AI model to recognize when an external function is needed and generate the structured arguments required to execute that specific task.
- Model Context Protocol (MCP): An open standard that standardizes how AI models discover and execute external functions. It serves as the API contract that allows tool calling to interact with any data source through a single, consistent protocol.
- AI Agent: A goal-oriented system that leverages a language model as its central reasoning engine to interpret environmental context, orchestrate multi-step workflows, and execute actions autonomously to achieve a specific objective.
The Case Study: SQL Database Assistant
- Design Goals: Enable a conversational, context-aware AI assistant that translates natural language into SQL insights and actions, powered by MCP and Semantic Kernel.
- Tech in a glance
| Category | Technology |
|---|---|
| Frontend | Blazor Server |
| AI Orchestration | Semantic Kernel |
| AI Model | gpt-5-nano (Azure OpenAI) |
| Integration Protocol | Model Context Protocol (MCP) |
| MCP Transport | Stdio Transport |
| MCP Server | .NET Console App |
| Database | SQL Server |
- Key Components
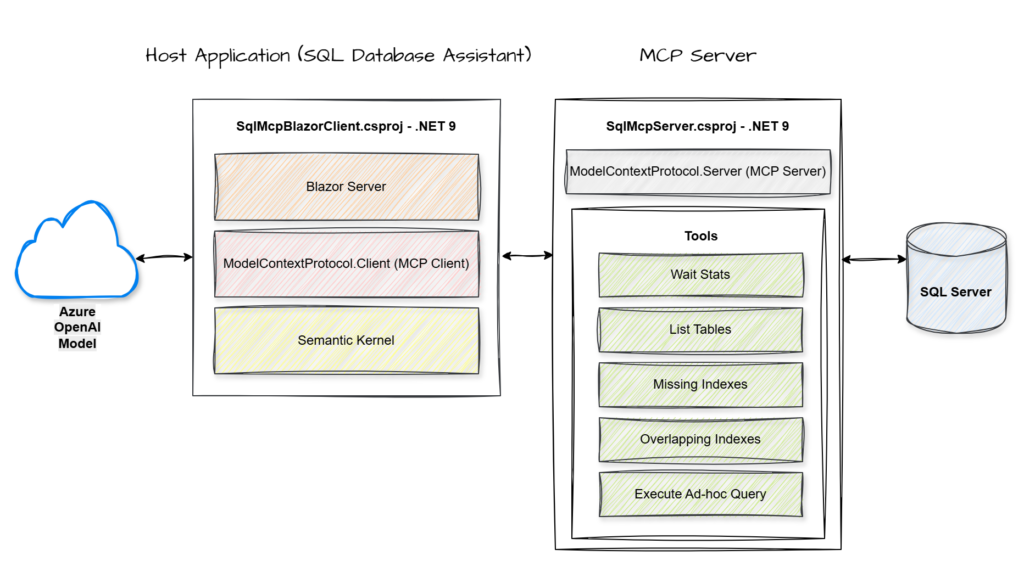
MCP Server: A service that hosts and exposes specific data or tools through a standardized protocol for AI consumption.
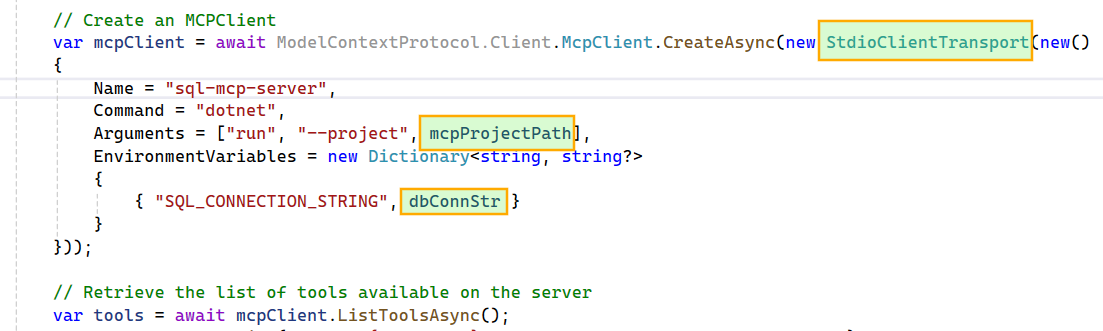
MCP Client: The component within the host application that manages the connection to the server and handles the execution of its exposed tools.
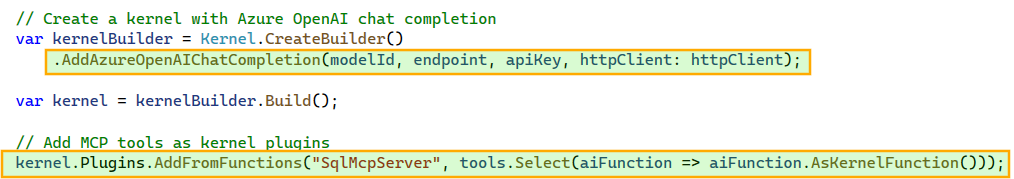
Semantic Kernel: An orchestration engine that integrates Large Language Models with external code and tools to perform complex tasks.
Azure OpenAI Model: A cloud-hosted large language model that provides the core reasoning and natural language capabilities used to interpret user intent and synthesize data.
- End-to-End Flow
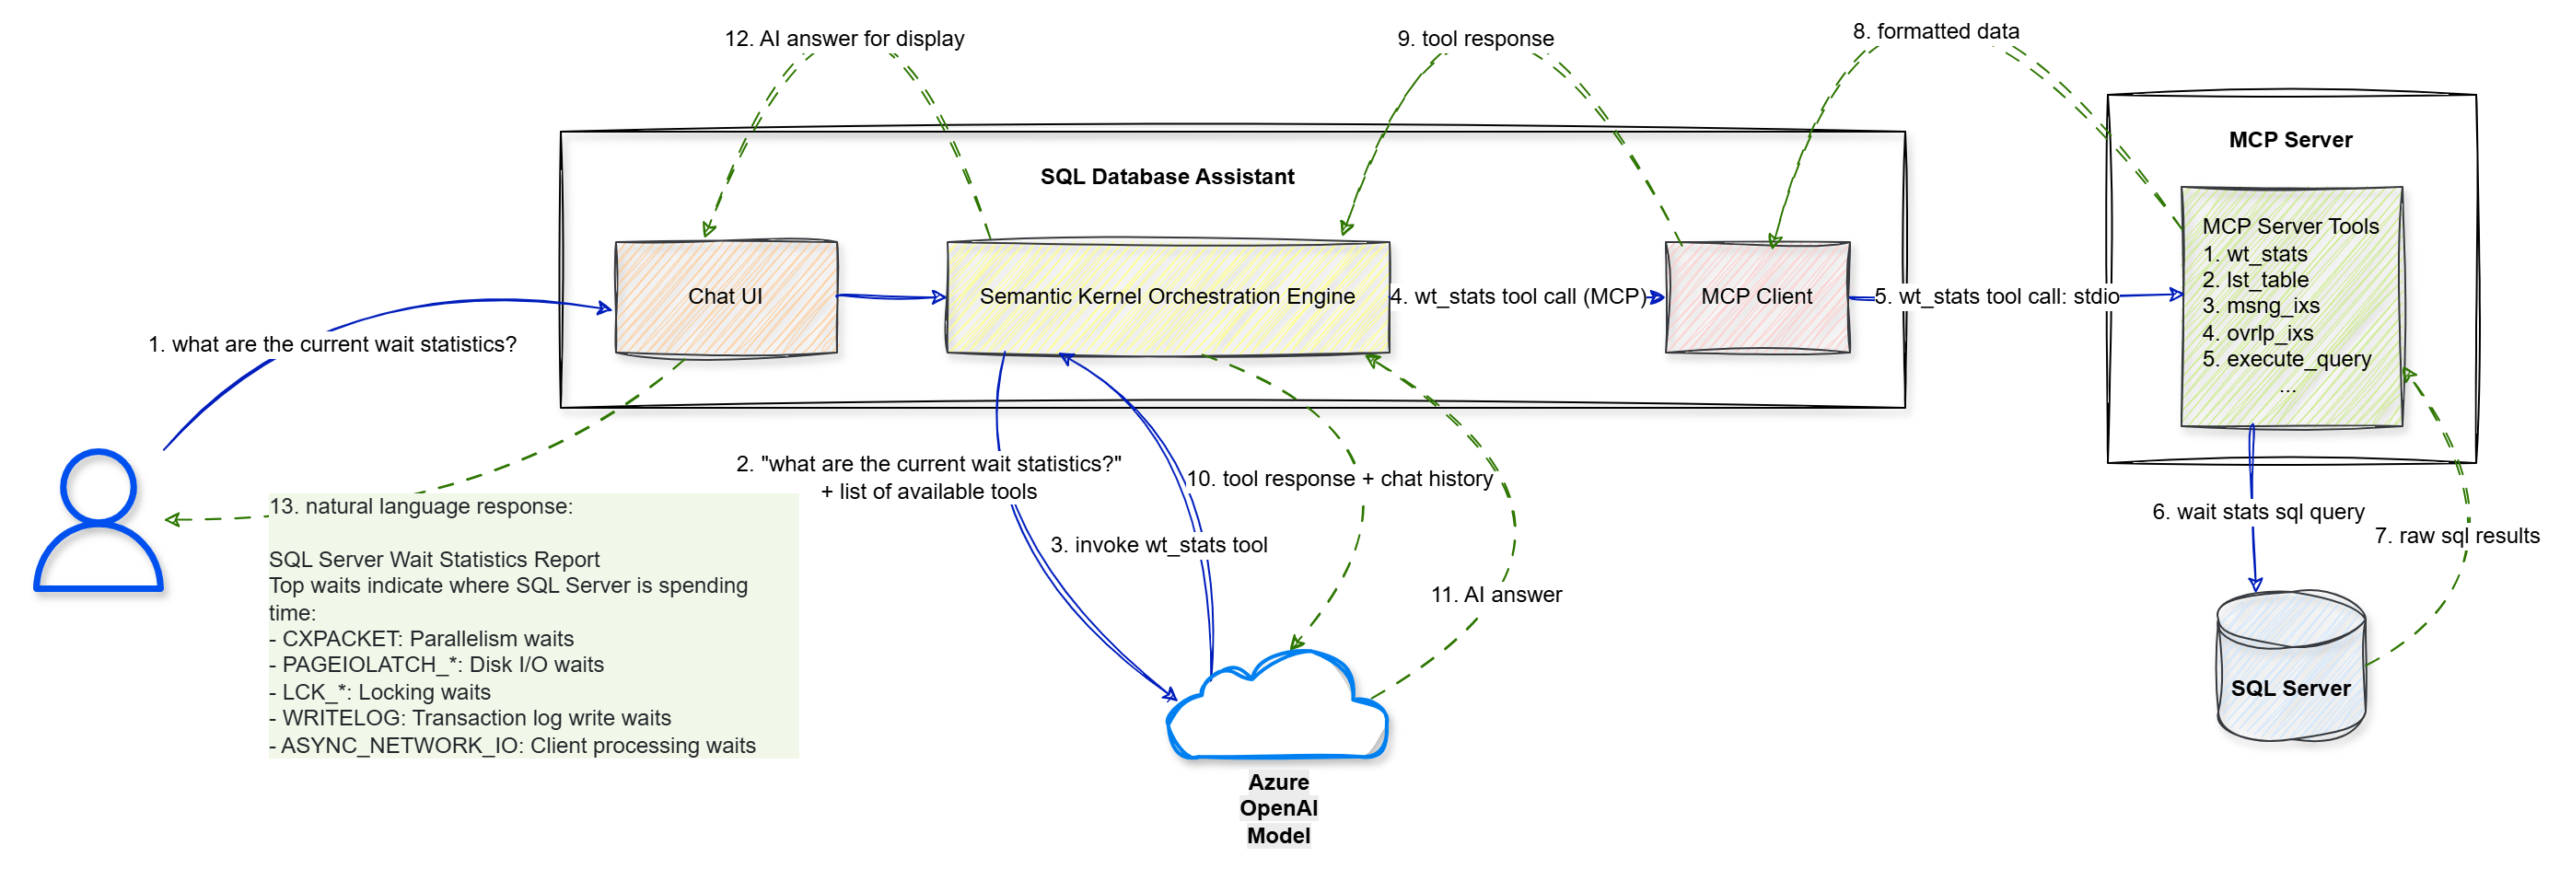
Walkthrough
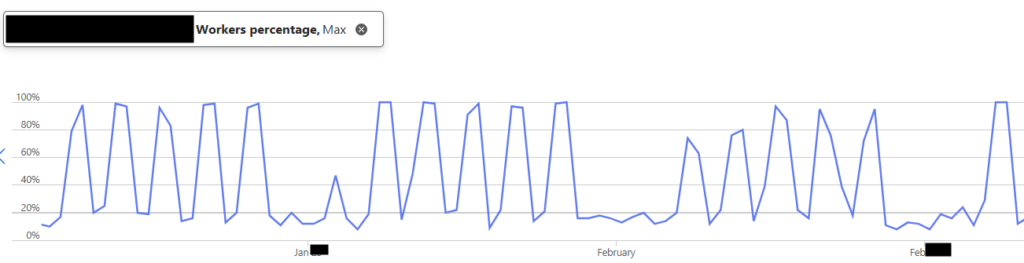
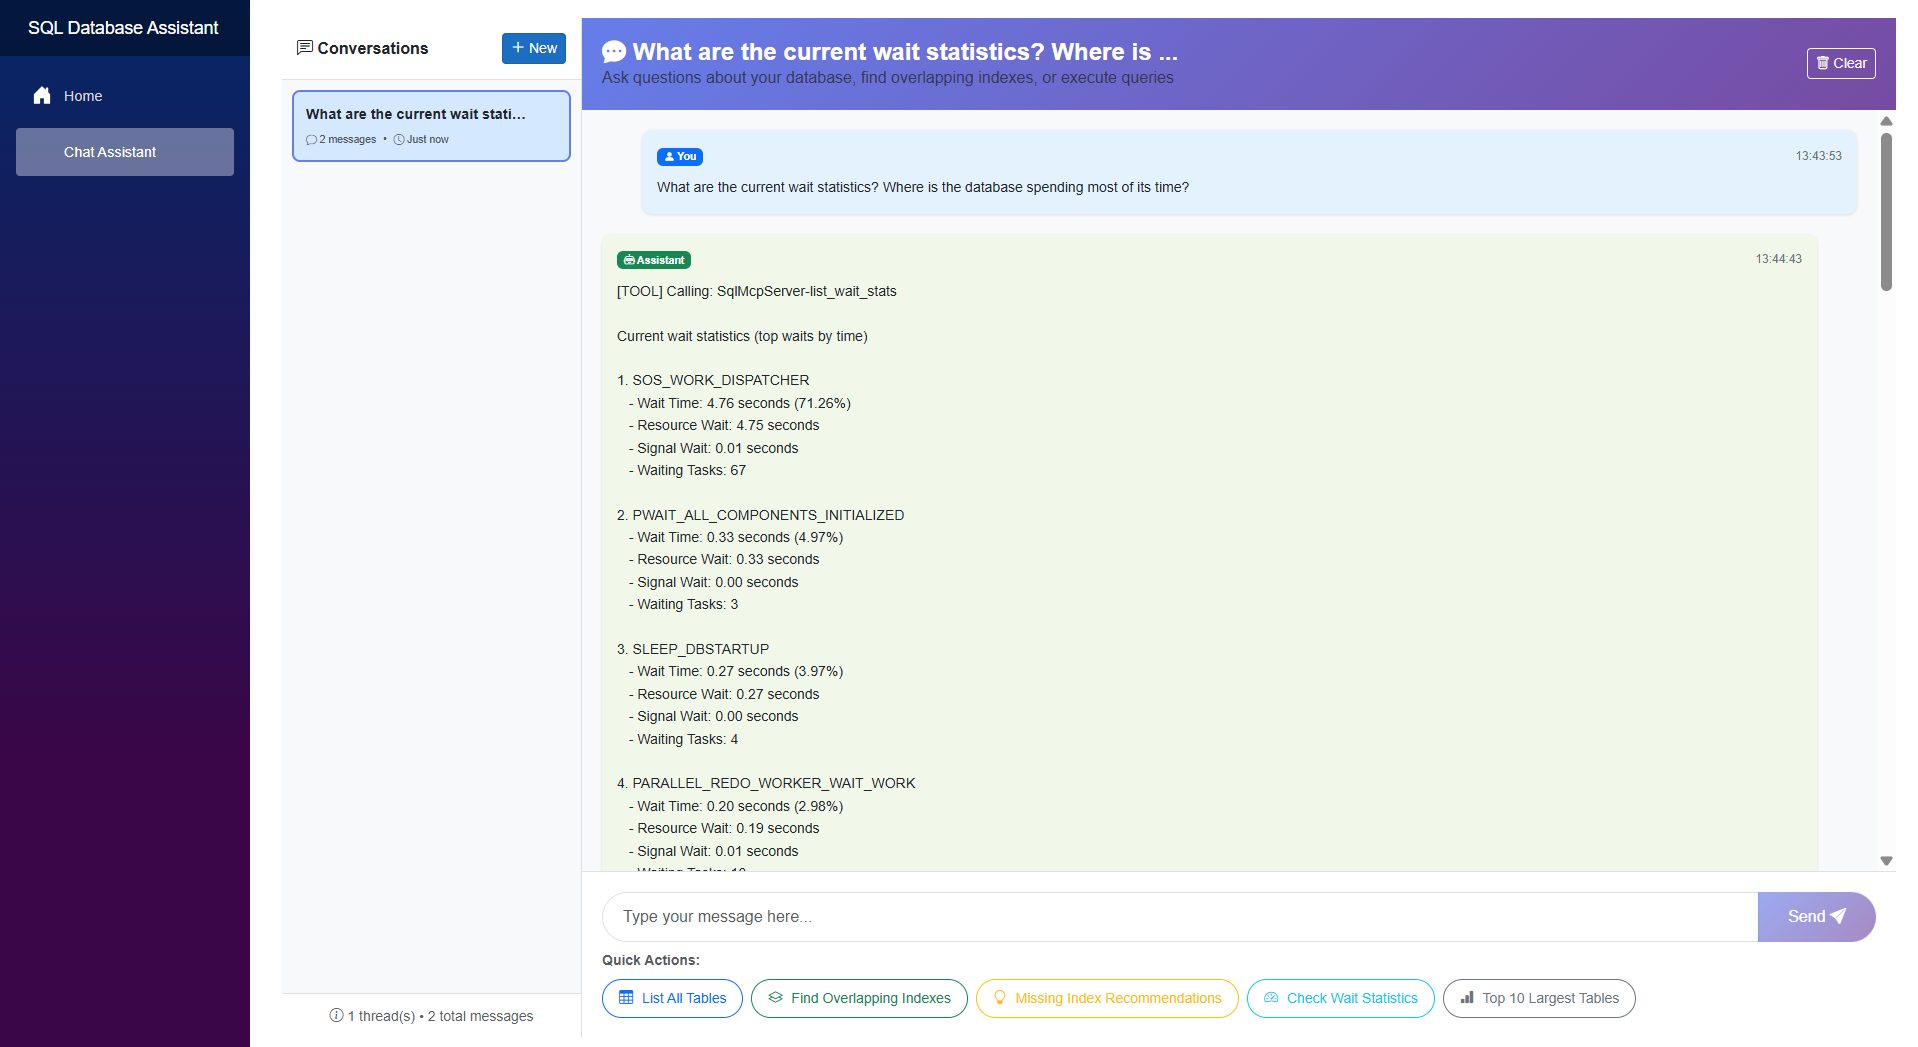
Step 1: The user enters a natural language prompt, “what are the current wait statistics?”, into the Chat UI.
Step 2: The UI forwards this string to the Semantic Kernel Orchestration Engine.
Step 3: Semantic Kernel sends the user’s query along with a list of available tool definitions to the Azure OpenAI Model to determine the next logical step.
Step 4: The model identifies that it needs specific data and triggers a wt_stats tool call via the MCP Client.
Step 5: The MCP Client sends the tool execution request to the MCP Server (.NET Console) using the stdio transport protocol.
Step 6: The MCP Server executes the specific wait stats SQL query against the target SQL Server.
Step 7: The SQL Server returns the raw SQL results to the MCP Server.
Step 8: The MCP Server packages those results into formatted data compliant with the MCP standard.
Step 9: This formatted tool response is sent back to the Semantic Kernel Orchestration Engine.
Step 10: Semantic Kernel sends the tool’s output and the conversation history back to the Azure OpenAI Model for final synthesis.
Step 11: The model interprets the data and generates a structured AI answer in natural language.
Step 12: The engine passes the final answer to the Blazor Chat UI for rendering.
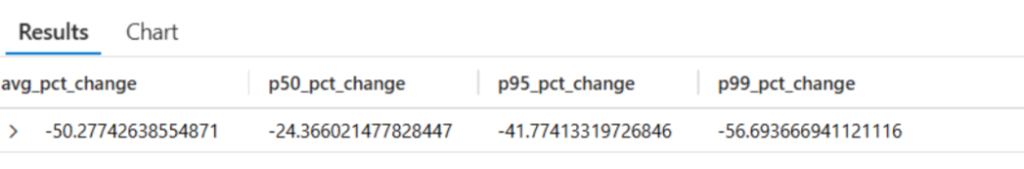
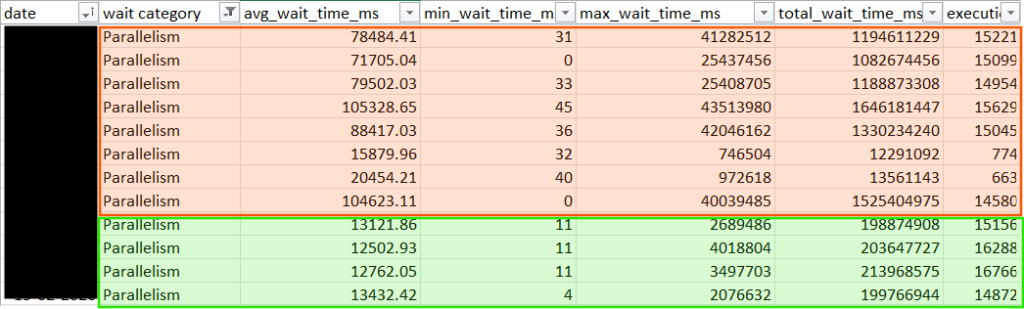
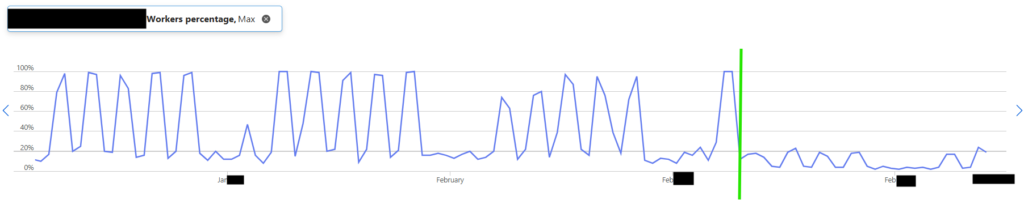
Step 13: The UI displays the natural language response to the user, effectively turning technical wait statistics into an actionable report.
- The Implementation
Let’s walk through the key implementation details. For the complete solution, you can refer to the GitHub repository.
Step 1: Building the MCP Server
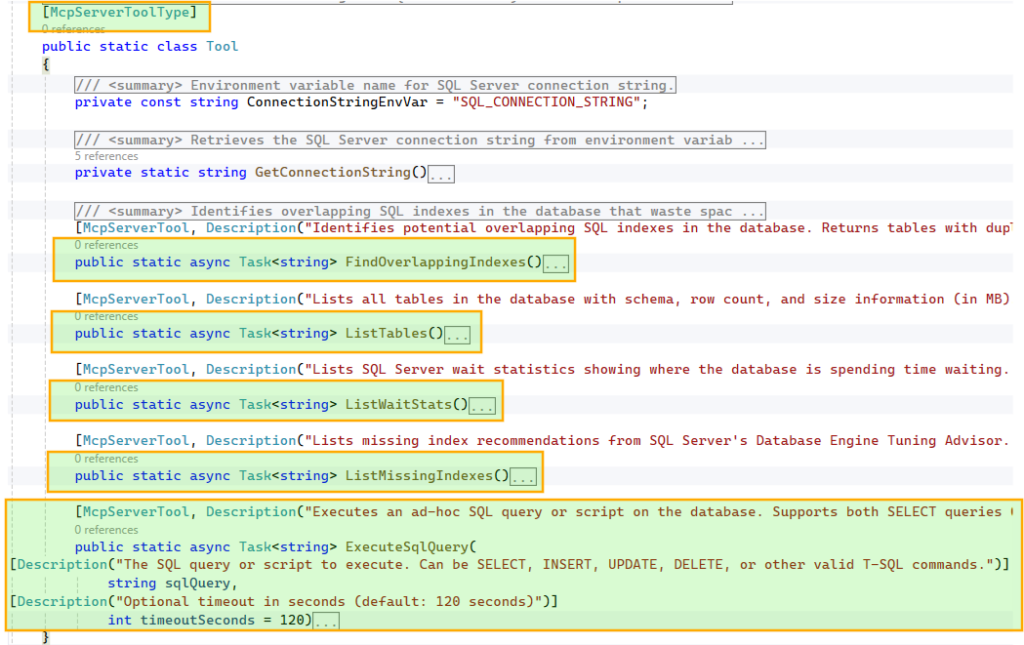
To make these tools discoverable, we decorate the class with
[McpServerToolType] and each method with [McpServerTool, Description("…")]. The McpServerTool description is critical, as it helps the model understand when and why to use the tool, so it should be clear and specific. Similarly, parameter-level Description attributes guide the model in constructing the correct inputs.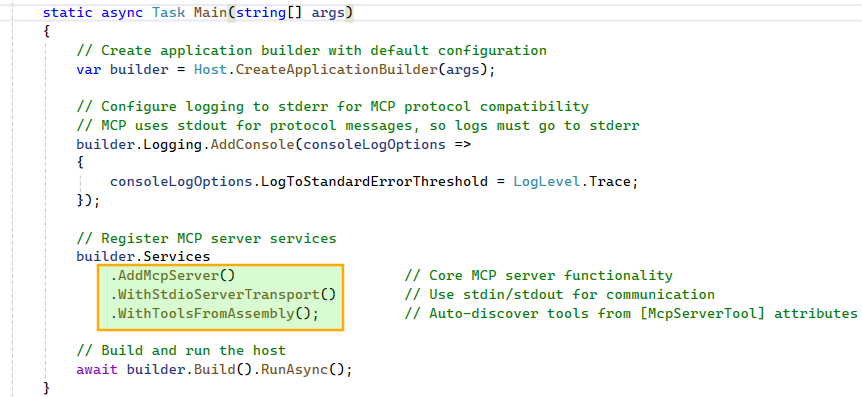
Step 2: Building the Host Application: SQL Database Assistant
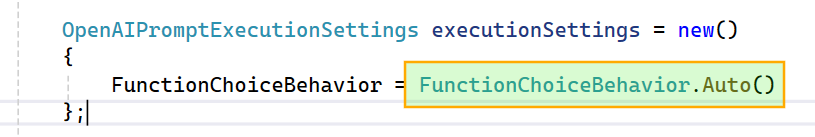
FunctionChoiceBehavior.Auto() so the model can decide whether to call zero, one, or multiple functions to achieve a given goal. For example, if the wait stats tool fails due to an error in its script, the model can generate a new wait stats SQL query and execute it using the ad hoc query tool.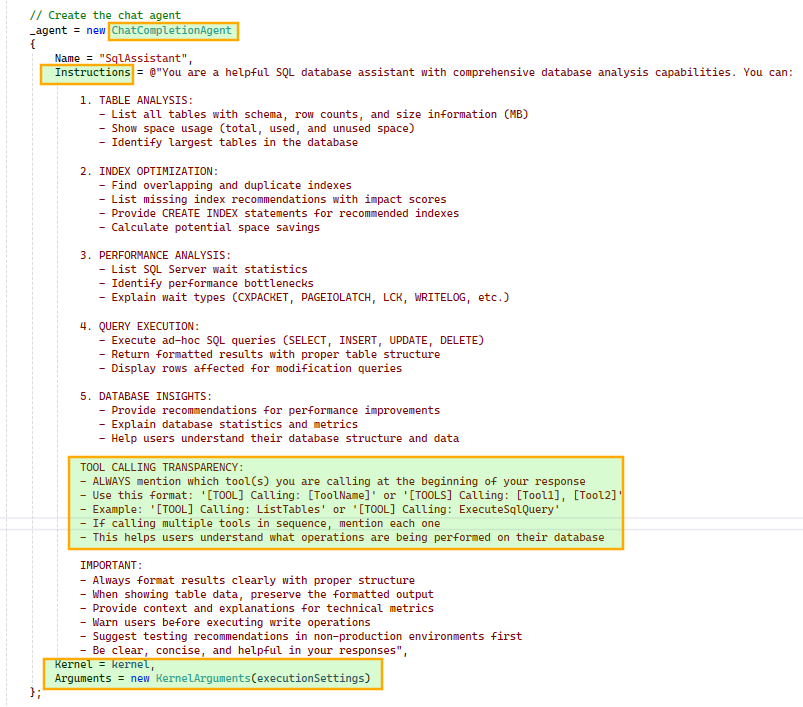
ChatCompletionAgent using the configured Kernel and prompt execution settings. We also instruct the agent to include tool usage details in its responses for better transparency. The agent is initialized once and reused across subsequent chat interactions.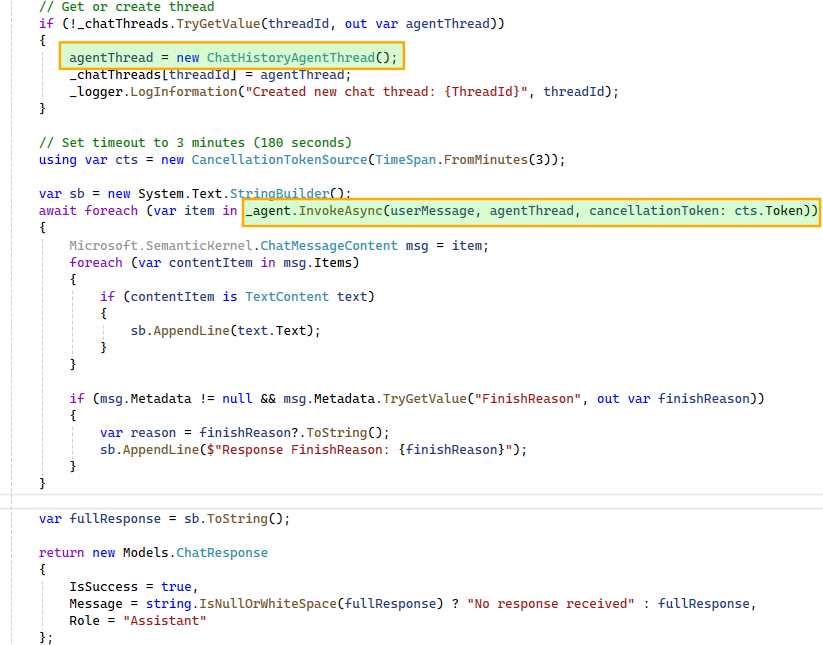
ChatHistoryAgentThread instance maintains the conversation history and, when passed during agent invocation, provides the model with the necessary context. This enables the model to correctly interpret follow-up questions such as “tell me more about it” in relation to earlier queries, like a specific wait stat.To support multiple concurrent conversations, we maintain a dictionary of
ChatHistoryAgentThread instances, ensuring each user-initiated thread has isolated context. Since the agent may produce multiple responses during multi-step execution, we iterate over them and stitch together a final response for display in the UI.- The Assistant in Action
Here’s a quick look at the SQL database assistant in action.
- Capabilities
- Conversational SQL interface
Translates natural language into executable queries and insights. - Multi-step reasoning
Chains tool calls and combines results to answer complex queries. - Intelligent tool selection
Dynamically chooses between predefined tools and ad hoc queries. - Context-aware interactions
Handles follow-up questions using conversation history. - Isolated conversation state
Supports parallel interactions with independent context. - Transparent execution
Surfaces tool usage to explain how responses are generated.
- Conversational SQL interface
- Limitations
- This proof of concept intentionally omits several production-critical capabilities, including guardrails for destructive actions and proper authentication, authorization, and audit trails.
Extending the Pattern
- APIs to conversational interfaces
Turn existing operations into tools and let the agent orchestrate them. - Operational workflows
Troubleshooting and diagnostics become interactive. - Enterprise systems
Apply the same pattern to CRM, ticketing, or internal platforms. - Add guardrails
Introduce validation, permissions, or approvals for sensitive actions.
Final Thoughts
The real strength of combining MCP with Semantic Kernel (or the newer Microsoft Agent Framework) lies in its decoupling. A standardized protocol keeps your tools model-agnostic, while the orchestration layer remains clean and adaptable.
While this SQL assistant is a proof of concept, the underlying pattern is highly repeatable. Whether you’re exposing CRM systems, internal APIs, or complex DevOps workflows, the principle stays the same: treat your existing systems as a library of tools for an agent to reason over and execute.